香港100M服务器
采用100M BGP混合带宽,可选15M或25M电信CN2带宽,搭配联通、移动直连线路,兼顾内地访问与国际网络连接,适合企业网站、跨境电商及应用部署等业务。


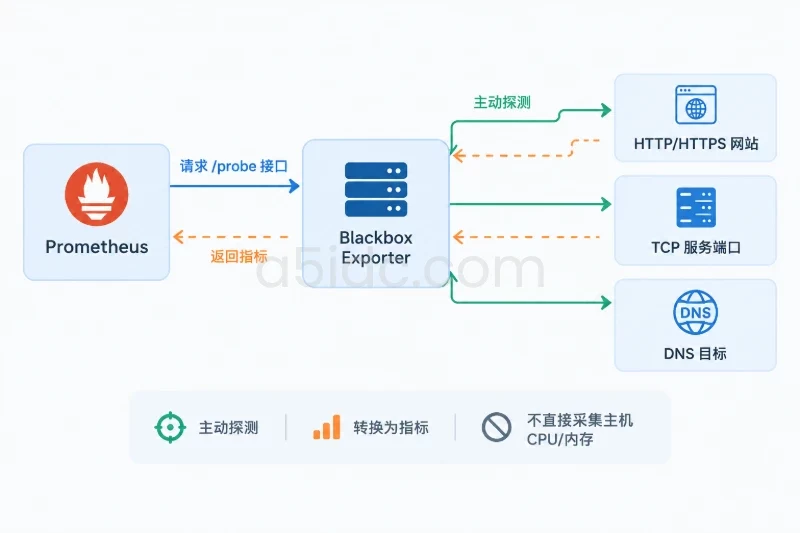
Blackbox Exporter 不直接采集服务器本机的 CPU、内存等资源指标,而是由 Prometheus 发起 HTTP、TCP、DNS 等主动探测,再将探测结果转成指标。首次部署时,建议先选定需要检查的 URL 或服务端口,安装 Exporter,配置 Prometheus 抓取任务,再根据探测结果设置告警。以下以 Debian/Ubuntu、systemd、Prometheus 与 Blackbox Exporter 部署在同一台服务器为例;跨服务器部署时,需额外限制 Exporter 监听地址和防火墙来源。
围绕网站、接口与网络服务的主动探测和告警场景,A5idc数据提供中国香港、美国、日本、韩国、中国台湾、新加坡及马来西亚等地区的物理服务器资源,可承载 Prometheus、Blackbox Exporter 及相关业务服务。不同地区配备 Xeon、AMD EPYC 等处理器、SSD或NVMe存储,并提供相应的国际及区域线路,便于构建贴近业务访问区域的监控节点与探测环境。
开始前确认以下条件:
curl、tar。可以用 uname -m 确认架构;下文以常见的 x86_64 架构为例。https://www.example.com/,以及需要检查的 TCP 服务地址,例如 db.example.com:3306。示例域名应替换为实际目标。127.0.0.1:9115;分机部署时,应使用 Prometheus 能访问的内网地址,并仅允许 Prometheus 服务器访问该端口。先检查 Prometheus 服务状态和现有配置路径:
sudo systemctl status prometheus --no-pager
sudo find /etc/prometheus -maxdepth 2 -type f -print
如果服务名或配置目录不同,以当前系统中的实际路径为准。修改 Prometheus 配置前先备份,避免覆盖已有抓取任务和告警规则。
以下以 Blackbox Exporter v0.25.0、Linux amd64 为安装示例。版本号是示例值,不代表当前最新版;生产环境应按实际需求选择受支持的版本,并核对发布页提供的校验信息。
VERSION=v0.25.0
ARCH=amd64
FILE="blackbox_exporter-${VERSION}.linux-${ARCH}.tar.gz"

curl -fL -o "/tmp/${FILE}" \
  "https://github.com/prometheus/blackbox_exporter/releases/download/${VERSION}/${FILE}"

tar -tzf "/tmp/${FILE}" | head
预期可以看到压缩包内包含 blackbox_exporter 可执行文件等内容。确认下载文件正常后,创建专用用户和安装目录:
sudo useradd --system --no-create-home --shell /usr/sbin/nologin blackbox_exporter
sudo install -d -o root -g root -m 0755 /etc/blackbox_exporter
sudo install -d -o root -g root -m 0755 /opt/blackbox_exporter
如果提示用户已经存在,先用 id blackbox_exporter 检查其用途,不要重复创建或修改现有账户。解压并安装程序:
sudo tar -xzf "/tmp/${FILE}" \
  --strip-components=1 \
  -C /opt/blackbox_exporter

sudo install -o root -g root -m 0755 \
  /opt/blackbox_exporter/blackbox_exporter \
  /usr/local/bin/blackbox_exporter

/usr/local/bin/blackbox_exporter --version
验证时应能输出版本信息。若提示架构不匹配或无法执行,重新核对 uname -m 与下载包架构;不要继续配置服务。
创建 /etc/blackbox_exporter/blackbox.yml:
modules:
  http_2xx:
    prober: http
    timeout: 5s
    http:
      method: GET
      preferred_ip_protocol: ip4
      ip_protocol_fallback: true

  tcp_connect:
    prober: tcp
    timeout: 5s
http_2xx 用于检查 HTTP/HTTPS 请求是否成功,tcp_connect 用于检查目标端口是否能建立 TCP 连接。这里的 timeout 是单次探测的超时上限,设置得过短可能把网络抖动误判为故障;若目标跨地域或响应较慢,可按实际情况适当增加。
设置配置文件权限并检查 YAML 缩进:
sudo chown root:root /etc/blackbox_exporter/blackbox.yml
sudo chmod 0644 /etc/blackbox_exporter/blackbox.yml
sudo sed -n '1,120p' /etc/blackbox_exporter/blackbox.yml
预期配置中 modules 下有 http_2xx、tcp_connect 两个模块,子项缩进一致。YAML 缩进错误通常会导致服务启动失败。
创建 /etc/systemd/system/blackbox_exporter.service:
[Unit]
Description=Prometheus Blackbox Exporter
After=network-online.target
Wants=network-online.target

[Service]
User=blackbox_exporter
Group=blackbox_exporter
Type=simple
ExecStart=/usr/local/bin/blackbox_exporter \
  --config.file=/etc/blackbox_exporter/blackbox.yml \
  --web.listen-address=127.0.0.1:9115
Restart=on-failure
RestartSec=5s
NoNewPrivileges=true
PrivateTmp=true
ProtectHome=true
ProtectSystem=strict

[Install]
WantedBy=multi-user.target
该监听地址仅适合同机 Prometheus。若 Prometheus 在另一台服务器上,把 127.0.0.1 改为本机内网地址,并在防火墙中仅放行 Prometheus 来源地址访问 TCP 9115;不要为方便验证而将该端口无条件开放到公网。
加载服务并启动:
sudo systemctl daemon-reload
sudo systemctl enable --now blackbox_exporter
sudo systemctl status blackbox_exporter --no-pager
预期状态为 active (running)。再检查本机指标接口:
curl -fsS http://127.0.0.1:9115/metrics | head
能返回以 # HELP、# TYPE 开头的指标说明,表示 Exporter Web 服务已启动。若服务未运行,先查看日志:
sudo journalctl -u blackbox_exporter -n 50 --no-pager
在 Prometheus 配置文件的 scrape_configs 中增加抓取任务。下面分别配置 HTTP 和 TCP 探测;请替换示例域名与端口。
scrape_configs:
  - job_name: blackbox-http
    metrics_path: /probe
    params:
      module: [http_2xx]
    static_configs:
      - targets:
          - https://www.example.com/
          - https://status.example.net/
    relabel_configs:
      - source_labels: [__address__]
        target_label: __param_target
      - source_labels: [__param_target]
        target_label: instance
      - target_label: __address__
        replacement: 127.0.0.1:9115

  - job_name: blackbox-tcp
    metrics_path: /probe
    params:
      module: [tcp_connect]
    static_configs:
      - targets:
          - db.example.com:3306
          - 192.0.2.20:443
    relabel_configs:
      - source_labels: [__address__]
        target_label: __param_target
      - source_labels: [__param_target]
        target_label: instance
      - target_label: __address__
        replacement: 127.0.0.1:9115
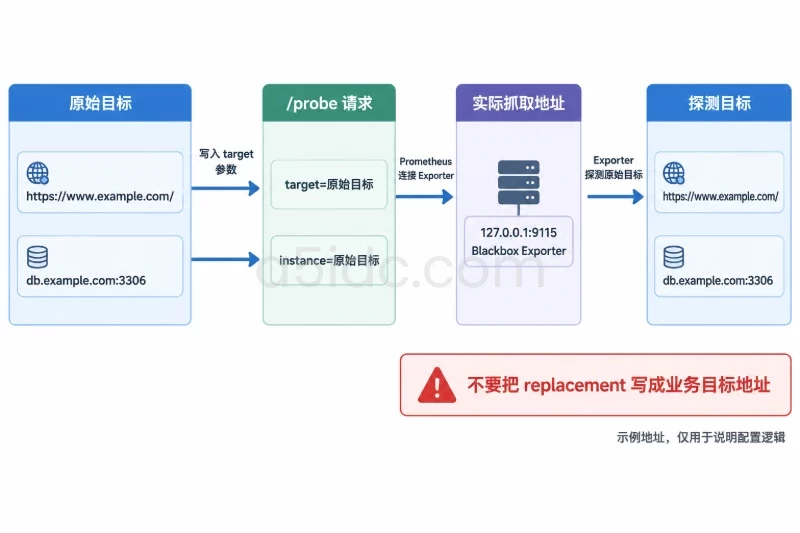
这里的重标记过程是:把原始目标写入 /probe 请求的 target 参数,将目标保留为 instance 标签,再把 Prometheus 实际抓取地址改为 Blackbox Exporter。不要把 replacement 写成业务目标地址,否则 Prometheus 会直接抓取目标,而不是通过 Exporter 探测。
若配置文件已有 scrape_configs,只需把两个任务合并进去,不能重复创建顶层配置。修改前备份并检查配置:
sudo cp -a /etc/prometheus/prometheus.yml \
  /etc/prometheus/prometheus.yml.bak.$(date +%Y%m%d%H%M%S)

sudo promtool check config /etc/prometheus/prometheus.yml
预期结果包含 SUCCESS。如果系统没有 promtool,先确认 Prometheus 的安装方式和二进制路径,再使用与当前 Prometheus 版本匹配的工具检查;不要在未验证 YAML 的情况下重载服务。检查通过后重载 Prometheus:
sudo systemctl reload prometheus
sudo systemctl status prometheus --no-pager
如果当前服务不支持 reload,可在确认配置通过后执行 sudo systemctl restart prometheus。重启会短暂中断 Prometheus 采集,应在允许的维护时段操作。
在 Exporter 同机执行以下命令,测试 HTTP 探测:
curl -fsS \
  'http://127.0.0.1:9115/probe?module=http_2xx&target=https://www.example.com/' \
  | grep -E '^(probe_success|probe_duration_seconds|probe_http_status_code)'
输出示例:
probe_duration_seconds 0.184
probe_http_status_code 200
probe_success 1
这是示例格式,不是实际执行记录。probe_success 1 表示该次探测成功,probe_success 0 表示失败;状态码、耗时则帮助判断具体表现。TCP 目标可以这样验证:
curl -fsS \
  'http://127.0.0.1:9115/probe?module=tcp_connect&target=db.example.com:3306' \
  | grep -E '^(probe_success|probe_duration_seconds)'
然后在 Prometheus 的 Graph 或查询页面检查:
up{job=~"blackbox-http|blackbox-tcp"}
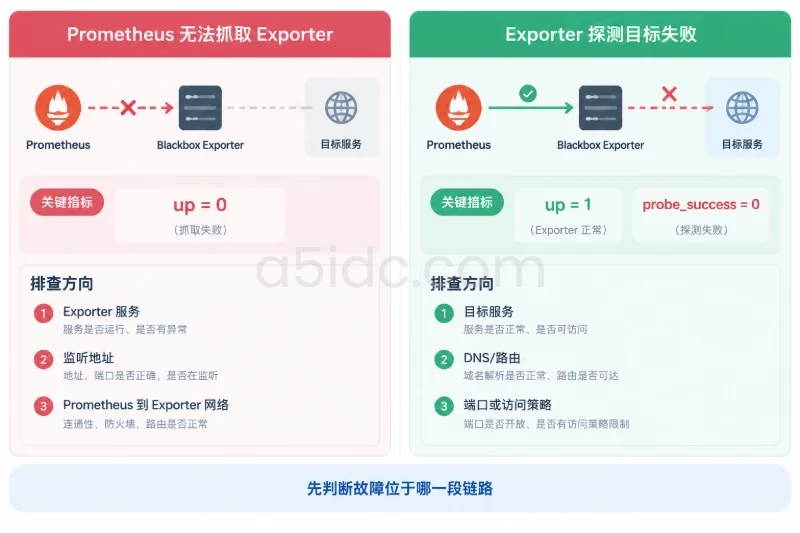
该值为 1 表示 Prometheus 能抓取 Exporter;这不等同于业务目标正常。目标探测状态需查看:
probe_success{job=~"blackbox-http|blackbox-tcp"}
只有 Exporter 可抓取且 probe_success 为 1,才能说明对应探测任务成功。
告警应区分“Prometheus 无法抓取 Exporter”和“Exporter 探测目标失败”。前者通常指向 Exporter 服务、监听地址或网络问题;后者可能是目标服务、DNS、路由或目标侧访问策略异常。
创建告警规则文件,例如 /etc/prometheus/blackbox_alerts.yml:
groups:
  - name: blackbox-alerts
    rules:
      - alert: BlackboxExporterScrapeFailed
        expr: up{job=~"blackbox-http|blackbox-tcp"} == 0
        for: 2m
        labels:
          severity: warning
        annotations:
          summary: "Prometheus 无法抓取 Blackbox Exporter"
          description: "检查 Exporter 服务、监听地址及 Prometheus 到 Exporter 的网络连接。"

      - alert: BlackboxProbeFailed
        expr: probe_success{job=~"blackbox-http|blackbox-tcp"} == 0
        for: 3m
        labels:
          severity: warning
        annotations:
          summary: "探测目标连续失败"
          description: "目标 {{ $labels.instance }} 连续探测失败,请检查目标服务与网络链路。"

      - alert: BlackboxHTTPHighLatency
        expr: probe_duration_seconds{job="blackbox-http"} > 2
        for: 5m
        labels:
          severity: warning
        annotations:
          summary: "HTTP 探测耗时偏高"
          description: "目标 {{ $labels.instance }} 连续多次探测耗时超过 2 秒。"

      - alert: BlackboxTLSCertificateExpiring
        expr: (probe_ssl_earliest_cert_expiry{job="blackbox-http"} - time()) < 14 * 24 * 3600
        for: 10m
        labels:
          severity: warning
        annotations:
          summary: "TLS 证书将在 14 天内到期"
          description: "检查目标 {{ $labels.instance }} 的证书续期计划。"
将规则文件加入 Prometheus 主配置的 rule_files,已有规则文件应保留:
rule_files:
  - /etc/prometheus/blackbox_alerts.yml
for 表示条件需持续满足一段时间才触发,可抑制短暂抖动。示例中的 3 分钟失败窗口、2 秒响应耗时和 14 天证书提醒是可调整的起始值,不适用于所有业务。对关键支付或登录入口,可缩短失败等待时间;对偶发网络波动较多的跨地域目标,可保留较长等待时间,并结合业务可接受的响应时限设定延迟阈值。
证书告警只适用于能提供 TLS 证书指标的 HTTPS 探测目标。如果查询结果没有对应序列,先确认该目标确实使用 HTTPS,并检查单次探测输出及 probe_ssl_earliest_cert_expiry 指标。不要仅依赖探测失败告警判断证书到期,证书到期前的独立提醒更利于安排续期。
告警降噪可从三方面入手:
for 延迟确认,并按业务影响划分 severity;不要对每一次瞬时失败立即发送高优先级通知。验证规则并重载 Prometheus:
sudo promtool check rules /etc/prometheus/blackbox_alerts.yml
sudo promtool check config /etc/prometheus/prometheus.yml
sudo systemctl reload prometheus
在 Prometheus 的 Alerts 页面检查规则是否已加载;恢复正常的目标通常应处于 Inactive。告警处于 Pending 表示条件已满足但尚未达到 for 时间,Firing 表示已达到触发条件。
按影响较小、信息量较高的方式检查:
| 表现 | 优先检查 | 常见原因 |
|---|---|---|
| Exporter 服务无法启动 | journalctl -u blackbox_exporter | 配置缩进错误、文件路径错误、端口已被占用 |
/metrics 可访问,但 /probe 失败 | 单目标 curl 输出及 probe_success | 目标无法解析、出站网络受限、目标端口未开放或超时过短 |
Prometheus 中 up=0 | Exporter 监听地址、Prometheus 目标地址与防火墙 | 服务未运行、Prometheus 无法连接 Exporter |
up=1 但 probe_success=0 | probe_http_status_code、探测耗时及目标服务日志 | Prometheus 能访问 Exporter,但目标探测本身失败 |
| HTTP 返回非预期状态码 | 检查目标 URL、跳转和访问策略 | 目标返回登录页、访问限制或业务错误状态 |
如果探测失败但服务本身正常,先从 Exporter 所在服务器直接请求目标,确认其 DNS 解析、出站路由和端口连通性。HTTP 探测还可能受目标侧来源地址限制;从浏览器可以访问,并不代表服务器所在网络也能访问。只有明确需要探测 ICMP 时才另行配置 ICMP 模块,并核对系统权限要求;首次部署 HTTP 与 TCP 探测不需要为此增加额外权限。

部署完成后,应至少确认以下结果:
active (running),本机 /metrics 可访问。up 为 1,且每个目标都有对应的 probe_success 序列。如果部署或重载后出现问题,先恢复 Prometheus 配置备份,再检查并重载配置。备份文件名按前文生成的时间戳选择:
sudo cp -a /etc/prometheus/prometheus.yml.bak.YYYYMMDDHHMMSS \
  /etc/prometheus/prometheus.yml

sudo promtool check config /etc/prometheus/prometheus.yml
sudo systemctl reload prometheus
确认备份文件路径正确后再执行复制,避免覆盖当前配置。若要撤销 Exporter,先停止并禁用服务:
sudo systemctl disable --now blackbox_exporter
再移除本次创建的 systemd 服务文件、配置和二进制前,确认它们没有被其他监控任务使用,并保留需要回溯的配置备份。完成后执行 sudo systemctl daemon-reload,确认 Prometheus 中不再保留已删除的抓取目标和规则。若曾开放 TCP 9115,也要按原防火墙规则回收该访问范围,并验证其他服务端口未受影响。
本文由A5数据原创发布,转载请注明出处:https://www.a5idc.com/helpcontent/6591.html