香港100M服务器
采用100M BGP混合带宽,可选15M或25M电信CN2带宽,搭配联通、移动直连线路,兼顾内地访问与国际网络连接,适合企业网站、跨境电商及应用部署等业务。


在 Windows 服务器上部署 windows_exporter,核心是完成两段配置:先让 exporter 以 Windows 服务运行,并通过 http://服务器地址:9182/metrics 暴露指标;再在 Prometheus 的 scrape_configs 中添加该地址。只要本机能够返回指标、Prometheus 端能够连通 9182 端口,并且目标状态为 UP,采集链路就基本建立完成。
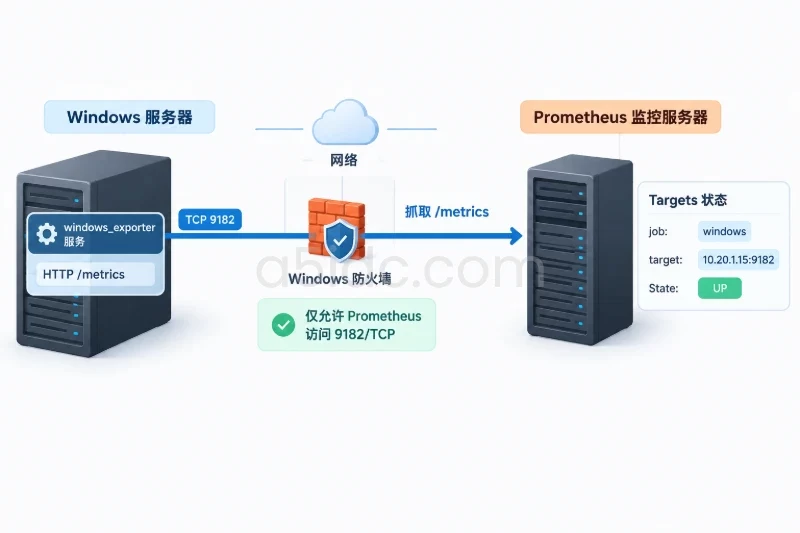
下面以 Windows x64 服务器、Prometheus 使用静态目标发现、默认 HTTP 端口 9182 为例。采集项包括 CPU、系统信息、逻辑磁盘、内存、网络、操作系统、服务和系统运行时间。具体安装包版本可以不同,但安装参数、验证方法和故障判断流程基本一致。
针对 Windows 服务器监控与 Prometheus 采集场景,A5idc数据提供中国香港、美国、日本、韩国、中国台湾、新加坡、马来西亚等地区的物理服务器资源,覆盖 Xeon Gold、AMD EPYC、SSD/NVMe、大内存及多带宽线路配置,可承载网站、业务后台、数据库和多任务运行,为 Windows 主机指标采集与持续运维提供相应的硬件与网络基础。
开始前确认以下条件:
windows_exporter MSI 安装包。可以先检查系统架构和端口占用情况:
[Environment]::Is64BitOperatingSystem

Get-NetTCPConnection -LocalPort 9182 -ErrorAction SilentlyContinue |
    Select-Object LocalAddress, LocalPort, State, OwningProcess
如果第一条命令返回 True,通常应选择 amd64 安装包。第二条命令没有输出,表示当前没有发现监听 9182 端口的连接;如果已经有程序占用该端口,需要改用其他端口,例如 9190,并同步修改 Prometheus 目标地址。
安装包下载后可以计算哈希值,并与发布页面提供的校验值人工比对:
Get-FileHash "C:\Install\windows_exporter-0.30.0-amd64.msi" -Algorithm SHA256
上面的版本号仅为示例,实际文件名应替换为已经下载的安装包名称。不要把未经确认的安装包直接用于生产服务器。
windows_exporter 通过 collector 采集不同类别的 Windows 指标。首次部署时,建议先启用能够覆盖主机基础监控的采集器:
| Collector | 主要用途 | 常见验证指标 |
|---|---|---|
cpu | CPU 各模式时间 | windows_cpu_time_total |
cs | 计算机名、系统基础信息 | windows_cs_hostname |
logical_disk | 逻辑磁盘容量和剩余空间 | windows_logical_disk_free_bytes |
memory | 可用内存等信息 | windows_memory_available_bytes |
net | 网络收发流量和错误 | windows_net_bytes_total |
os | 操作系统信息 | windows_os_info |
service | Windows 服务状态 | windows_service_state |
system | 系统运行时间等信息 | windows_system_system_up_time |
不同版本可能新增或调整部分指标名称,最终以本机 /metrics 返回的内容为准。service 采集器会产生较多服务相关时间序列;如果服务器上服务数量很多,首次部署也可以先不启用它,待基础指标验证完成后再单独加入。
创建安装日志目录,然后执行 MSI 安装。以下命令使用静默模式,适合通过远程管理工具或批量脚本执行:
New-Item -ItemType Directory -Path "C:\Temp" -Force | Out-Null

$Installer = "C:\Install\windows_exporter-0.30.0-amd64.msi"

msiexec.exe /i $Installer `
  "ENABLED_COLLECTORS=cpu,cs,logical_disk,memory,net,os,service,system" `
  "LISTEN_PORT=9182" `
  /qn `
  /norestart `
  /l*v "C:\Temp\windows_exporter-install.log"

$LASTEXITCODE
如果返回值为 0,通常表示 MSI 安装成功。非零返回值需要查看安装日志,不要直接重复执行多次。部分版本的 MSI 属性名称可能存在差异,遇到安装程序不接受参数时,应先查看该版本的安装说明或使用图形化安装程序确认选项。
安装后,检查服务是否存在、是否运行以及实际启动参数:
Get-CimInstance Win32_Service -Filter "Name='windows_exporter'" |
    Format-List Name, State, StartMode, PathName
正常情况下可以看到类似结果:
Name      : windows_exporter
State     : Running
StartMode : Auto
PathName  : "C:\Program Files\windows_exporter\windows_exporter.exe" ...
这里的路径和参数仅作为示例。不要根据示例路径直接判断安装是否正确,应以 PathName 的实际返回值为准。
如果服务已经存在但状态不是 Running,可以手动启动:
Start-Service -Name windows_exporter
Set-Service -Name windows_exporter -StartupType Automatic

Get-Service -Name windows_exporter
预期结果中的 Status 应为 Running。如果启动后很快又停止,先查看端口和服务启动参数:
Get-NetTCPConnection -LocalPort 9182 -ErrorAction SilentlyContinue |
    Select-Object LocalAddress, LocalPort, State, OwningProcess

Get-CimInstance Win32_Service -Filter "Name='windows_exporter'" |
    Select-Object Name, State, StartMode, PathName
如果 9182 已被其他程序占用,应为 exporter 选择空闲端口。例如重新安装或修改安装参数时使用 9190:
LISTEN_PORT=9190
修改端口后,后续本机验证地址和 Prometheus 的 targets 必须同时改为 9190。
服务显示为运行状态,并不等于 HTTP 指标端点一定可用。先从 Windows 服务器本机访问:
$Response = Invoke-WebRequest `
    -Uri "http://127.0.0.1:9182/metrics" `
    -UseBasicParsing

$Response.StatusCode

$Response.Content -split "`n" |
    Select-String -Pattern "^(# HELP|windows_exporter_build_info|windows_cpu_time_total|windows_memory_available_bytes)"
预期状态码为:
200
输出中通常可以看到以 # HELP、# TYPE 开头的 Prometheus exposition 格式内容,以及类似以下指标:
# HELP windows_cpu_time_total ...
# TYPE windows_cpu_time_total counter
windows_cpu_time_total{core="...",mode="idle"} ...
# HELP windows_memory_available_bytes ...
windows_memory_available_bytes ...
数值会随服务器状态变化,示例中的数值不代表实际执行结果。只要响应状态为 200,内容不是 HTML 错误页,并且能够找到 windows_ 开头的指标,说明 exporter 已能正常暴露数据。
还可以直接检查监听地址:
Get-NetTCPConnection -LocalPort 9182 -State Listen |
    Select-Object LocalAddress, LocalPort, State, OwningProcess
如果监听地址是 0.0.0.0 或服务器的实际内网地址,远程 Prometheus 通常可以访问。如果只监听 127.0.0.1,只能本机访问,需要根据当前版本的安装参数或服务启动参数调整监听地址。调整前先保存原有 PathName,避免覆盖其他启动选项。
如果 Prometheus 与 exporter 不在同一台服务器上,需要允许 Prometheus 服务器访问 Windows 的 9182/TCP。防火墙规则应尽量限制来源地址,不建议直接对所有来源开放。
下面假设 Prometheus 服务器地址为 10.20.1.10,Windows exporter 服务器地址为 10.20.1.15:
New-NetFirewallRule `
    -DisplayName "Prometheus windows_exporter 9182" `
    -Direction Inbound `
    -Protocol TCP `
    -LocalPort 9182 `
    -Action Allow `
    -Profile Domain,Private `
    -RemoteAddress 10.20.1.10
该操作会改变服务器入站访问策略,执行前应确认来源 IP 固定且规则名称不会与现有规则冲突。不要在公网配置中直接使用 RemoteAddress Any,也不要把 9182 端口暴露到不受控的网络。
检查规则:
Get-NetFirewallRule -DisplayName "Prometheus windows_exporter 9182" |
    Format-List DisplayName, Enabled, Direction, Action, Profile
从 Prometheus 所在服务器测试端口连通性。若 Prometheus 服务器也是 Windows,可以执行:
Test-NetConnection -ComputerName 10.20.1.15 -Port 9182
预期看到:
TcpTestSucceeded : True
如果 Prometheus 服务器是 Linux,可以使用:
curl -fsS http://10.20.1.15:9182/metrics | head
本机访问正常而远程访问失败时,优先检查防火墙、路由、安全组和监听地址,不要先修改 exporter 的采集器配置。
修改 Prometheus 配置前先创建备份。下面以 Linux Prometheus 配置路径为例:
cp /etc/prometheus/prometheus.yml \
   /etc/prometheus/prometheus.yml.bak.$(date +%Y%m%d%H%M%S)
如果 Prometheus 运行在 Windows,可以使用:
$Backup = "C:\Prometheus\prometheus.yml.bak-" +
    (Get-Date -Format "yyyyMMddHHmmss")

Copy-Item "C:\Prometheus\prometheus.yml" $Backup
scrape_configs在 Prometheus 的 prometheus.yml 中,将目标加入现有的 scrape_configs。不要删除其他 job,以下片段应与原配置合并:
scrape_configs:
  - job_name: "windows"
    scrape_interval: 15s
    scrape_timeout: 10s
    static_configs:
      - targets:
          - "10.20.1.15:9182"
        labels:
          node: "win-app-01"
需要注意以下几点:
10.20.1.15 应替换为 Windows 服务器从 Prometheus 侧可访问的 IP 或 DNS 名称。127.0.0.1:9182。scrape_timeout 必须小于 scrape_interval。node 是自定义标签,可用于区分主机;Prometheus 默认还会为目标生成 instance 标签。node 标签。多目标示例:
scrape_configs:
  - job_name: "windows"
    scrape_interval: 15s
    scrape_timeout: 10s
    static_configs:
      - targets:
          - "10.20.1.15:9182"
        labels:
          node: "win-app-01"
      - targets:
          - "10.20.1.16:9182"
        labels:
          node: "win-db-01"
在应用配置前,用与 Prometheus 版本匹配的 promtool 检查语法:
promtool check config /etc/prometheus/prometheus.yml
Windows Prometheus 可以执行:
.\promtool.exe check config .\prometheus.yml
预期输出类似:
Checking /etc/prometheus/prometheus.yml
 SUCCESS: 0 rule files found
检查通过后再加载配置。如果 Prometheus 启动时启用了生命周期接口,可以执行:
curl -X POST http://127.0.0.1:9090/-/reload
如果没有启用该接口,则使用现有的服务管理方式重启 Prometheus。重启前必须确认 promtool check config 已通过,否则可能导致 Prometheus 无法正常启动。
打开 Prometheus 的 Targets 页面:
http://Prometheus地址:9090/targets
找到 windows job,确认以下项目:
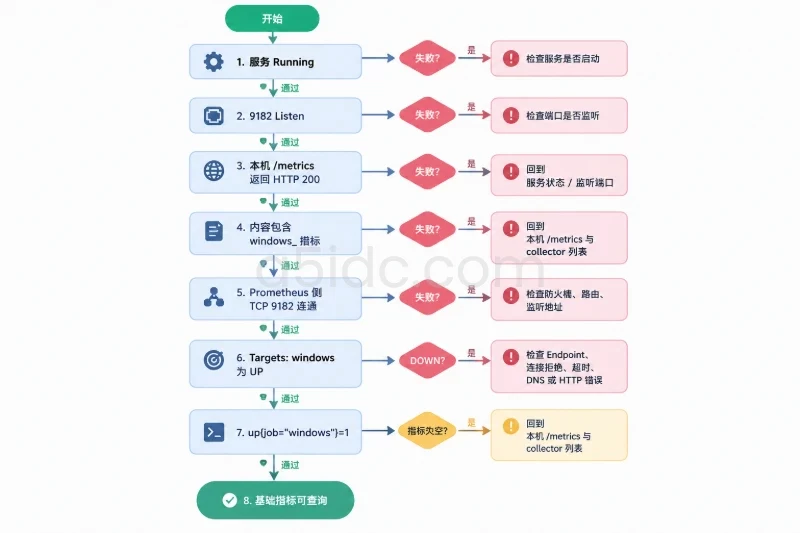
State 为 UP。Last Scrape 能持续更新。Last Scrape Error 为空。Endpoint 指向正确的 Windows IP 和 9182 端口。也可以直接在 Prometheus 查询页面执行:
up{job="windows"}
返回值为 1 表示最近一次抓取成功;返回 0 表示目标已被发现,但抓取失败。没有任何结果,通常表示 job 配置没有加载,或者查询中的 job 名称与配置不一致。
依次执行以下 PromQL:
windows_exporter_build_info{job="windows"}
windows_memory_available_bytes{job="windows"}
windows_logical_disk_free_bytes{job="windows"}
windows_cpu_time_total{job="windows"}
这些查询分别用于确认 exporter 本身、内存、磁盘和 CPU collector 是否产生数据。指标名称可能随版本或采集器实现变化,遇到空结果时,可以先在 Prometheus 的表达式浏览器中搜索 windows_,或者回到 Windows 本机的 /metrics 端点确认实际名称。
CPU 使用率通常需要对累计时间指标进行计算,不能直接把 windows_cpu_time_total 当作百分比使用。一个常见的主机级估算表达式是:
100 *
(
  1 -
  sum by (instance) (
    rate(windows_cpu_time_total{job="windows", mode="idle"}[5m])
  )
  /
  sum by (instance) (
    rate(windows_cpu_time_total{job="windows"}[5m])
  )
)
如果当前版本的 CPU 指标标签名称或模式值不同,应先查看实际返回的 mode 标签,再调整查询。磁盘剩余空间则可以直接查看字节值:
windows_logical_disk_free_bytes{job="windows"}
Prometheus 查询结果的单位是字节。展示为 GB 时,需要在图表单位中选择字节或按监控平台的显示规则换算,不要把字节值直接当成 GB。
| 现象 | 优先检查 | 处理方向 |
|---|---|---|
找不到 windows_exporter 服务 | MSI 安装返回码、安装日志 | 确认安装包架构和 MSI 参数,查看 C:\Temp\windows_exporter-install.log |
| 服务启动后停止 | PathName、9182 端口、系统事件日志 | 检查端口冲突、启动参数错误或权限问题 |
| 本机访问 9182 失败 | 服务状态、监听端口 | 服务未运行或监听端口与预期不一致 |
| 本机正常,远程失败 | Test-NetConnection、防火墙规则、路由 | 限定来源 IP 放行 9182,确认监听地址不是仅本机 |
Prometheus 显示 DOWN | Targets 页面错误信息 | 区分连接拒绝、超时、DNS 失败和 HTTP 状态码错误 |
up 为 1 但某个指标为空 | 本机 /metrics、collector 列表 | 相关 collector 未启用,或当前版本指标名称不同 |
| 抓取耗时较长 | Targets 中的 scrape duration、collector 范围 | 减少不必要的 collector,重点评估 service 采集器的时间序列数量 |
如果 Prometheus 报告 connection refused,通常表示目标端没有监听该端口或被防火墙拒绝;如果报告 context deadline exceeded,则更偏向于网络路径、策略设备或服务器负载问题。先使用本机和远程端点测试区分范围,再修改配置。
首次部署完成后,至少确认:
windows_exporter 服务存在,状态为 Running。/metrics 返回 HTTP 200。windows_ 指标,而不是错误页面。windows job 状态为 UP。up{job="windows"} 返回 1。如果需要撤销本次部署,先从 Prometheus 配置中删除对应的 windows target,执行 promtool check config 后再重新加载或重启 Prometheus。这样可以先停止新的抓取任务,避免在 exporter 已关闭后持续产生目标错误。
然后删除本次专门创建的防火墙规则。确认该规则没有被其他采集程序共用后再执行:
Remove-NetFirewallRule -DisplayName "Prometheus windows_exporter 9182"
最后通过“应用和功能”卸载对应版本的 MSI,或使用原安装包执行卸载:
msiexec.exe /x "C:\Install\windows_exporter-0.30.0-amd64.msi" `
    /qn `
    /norestart `
    /l*v "C:\Temp\windows_exporter-uninstall.log"
卸载前应确认该 MSI 对应的确实是本次安装实例,避免误删其他版本或其他主机管理流程使用的组件。回滚后再次检查服务、9182 监听端口、防火墙规则和 Prometheus Targets 页面,确保没有遗留目标或入站规则。Prometheus 已经保存的历史时间序列通常不会因删除采集目标立即消失;如果还需要清理历史数据,应按照 Prometheus 的数据保留和存储管理策略单独处理。
本文由A5数据原创发布,转载请注明出处:https://www.a5idc.com/helpcontent/6254.html