
服务器的网络诊断是高效服务器租用解决方案的核心环节。深入了解traceroute和ping命令的不同功能,能够帮助进行精准的网络故障排查与性能优化,从而提高整体系统的稳定性和响应速度。
Ping 通过 ICMP 数据包测量基本连接性和往返时间:
ping example.com
PING example.com (93.184.216.34): 56 data bytes
64 bytes from 93.184.216.34: icmp_seq=0 ttl=56 time=14.919 ms
64 bytes from 93.184.216.34: icmp_seq=1 ttl=56 time=14.303 ms
64 bytes from 93.184.216.34: icmp_seq=2 ttl=56 time=14.471 ms
64 bytes from 93.184.216.34: icmp_seq=3 ttl=56 time=14.385 ms
Traceroute 操作
Traceroute 显示完整的网络路径:
traceroute example.com
1 gateway (192.168.1.1) 1.123 ms
2 isp-router (10.0.0.1) 14.432 ms
3 backbone (172.16.0.1) 15.187 ms
4 example.com (93.184.216.34) 14.919 ms
主要区别和应用
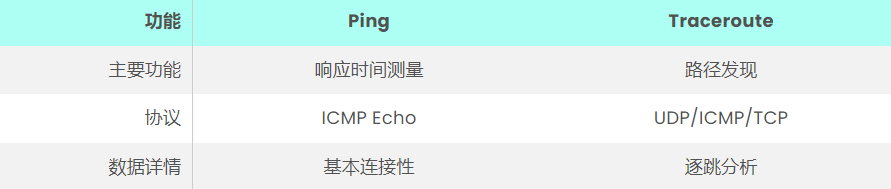
性能分析场景
Ping 应用场景
快速连接检查
响应时间监控
基本可用性测试
持续运行时间验证
Traceroute 优势
路由优化
瓶颈识别
网络映射
路径验证
故障排除方法
有效的网络诊断需要策略性地使用工具:
延迟调查
ping -c 10 -i 0.5 target-server.com
--- target-server.com ping statistics ---
10 packets transmitted, 10 received, 0% packet loss
round-trip min/avg/max = 12.4/13.2/15.8 ms
路径分析
traceroute -n -w 2 target-server.com
1 192.168.1.1 0.456 ms
2 10.0.0.1 1.234 ms
3 172.16.0.1 2.345 ms
* * * Request timed out
高级使用模式
网络管理员利用高级选项:
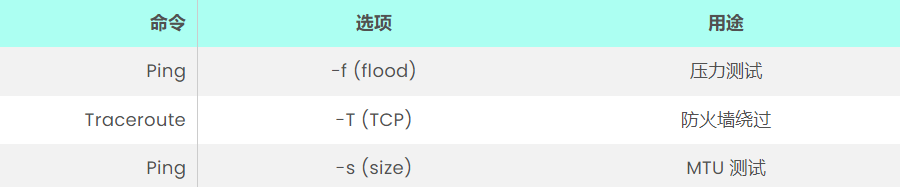
扩展命令选项
MTR (My TraceRoute)
mtr --report google.com
HOST: local Loss% Snt Last Avg Best Wrst StDev
1. gateway 0.0% 10 0.4 0.4 0.3 0.5 0.1
2. isp-router 0.0% 10 1.2 1.4 1.1 1.8 0.2
3. backbone 0.0% 10 15.2 15.4 15.1 15.9 0.3
Custom Interval Ping
ping -i 0.2 -c 100 server.com # Faster ping rate
ping -D server.com # Add timestamps
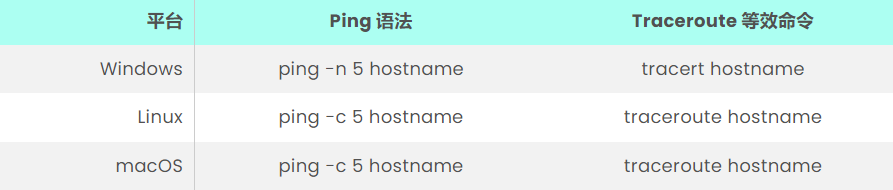
跨平台注意事项
不同操作系统提供这些诊断工具的实现方式有所不同:
平台 Ping 语法 Traceroute 等效命令
特殊注意事项
Windows:ICMP 数据包可能默认被阻止
Linux:某些选项需要 root 权限
macOS:内置网络诊断集成
实施指南
遵循以下做法以获得最佳结果:
定期测试计划
每小时运行状态检查
每日路由验证
每周性能基准
结果记录
响应时间趋势
路径变化
异常模式
自动化最佳实践
#!/bin/bash
# Automated network diagnostics
HOSTS=("server1.com" "server2.com" "server3.com")
LOG_FILE="/var/log/network_diagnostics.log"

for host in "${HOSTS[@]}"; do
echo "Testing $host at $(date)" >> $LOG_FILE
ping -c 4 $host >> $LOG_FILE
traceroute $host >> $LOG_FILE
done
自动化的优势:
一致的监控间隔
历史数据收集
趋势分析能力
预警系统
实际案例研究
电子商务平台
发现的问题:间歇性高延迟
ping -c 100 ecommerce-server.com | grep 'time='
64 bytes from 203.0.113.1: time=23.4 ms
64 bytes from 203.0.113.1: time=152.7 ms
64 bytes from 203.0.113.1: time=24.1 ms
内容分发网络
已解决问题:路由效率低下
traceroute cdn-edge.com
1 gateway (192.168.1.1) 0.345 ms
2 * * * Request timed out
3 backbone (172.16.0.1) 15.678 ms
数据中心迁移
挑战:验证迁移前后的网络性能
迁移前分析:
ping -c 1000 old-datacenter.com | awk '/time=/ {sum+=$7} END {print sum/NR}'
Average RTT: 23.45 ms
迁移后验证:
ping -c 1000 new-datacenter.com | awk '/time=/ {sum+=$7} END {print sum/NR}'
Average RTT: 15.67 ms
结果:优化后响应时间提升33%
性能监控
建立基准指标
设置警报阈值
监控长期趋势
故障排除流程
从 ping 测试开始
升级到 traceroute
记录发现
工具集成策略
有效组合诊断工具:
#!/bin/bash
# Combined network diagnostics
echo "Running ping test..."
ping -c 4 target-server.com
echo "Running traceroute..."
traceroute target-server.com
未来新兴的诊断功能包括:
AI 驱动分析
自动响应系统
可视化路径映射
实时优化
理解traceroute和ping命令的不同角色对服务器租用环境至关重要。这些基本的诊断工具在正确实施时,能确保最佳网络性能和快速问题解决。